Immigration in Chicago
Telling the story of city and exploring the impact of immigration through data
2023
Data Visualization

The
Brief
Chicago is a city of neighborhoods, each of which has a rich history and culture. From the Ukrainian Village to the Polish and Lithuanian Broadways, to the "Black Metropolis" of Bronzeville, immigrants and immigration have played a strong role in shaping the city.
As part of a class on data visualization taught by Elizabeth Durango-Cohen at the Stuart School of Business, Smrti Ganesan, Naomi Ito and I explored the story of immigration into Chicago through the use of publicly available data.
Through this exercise we wanted to understand:
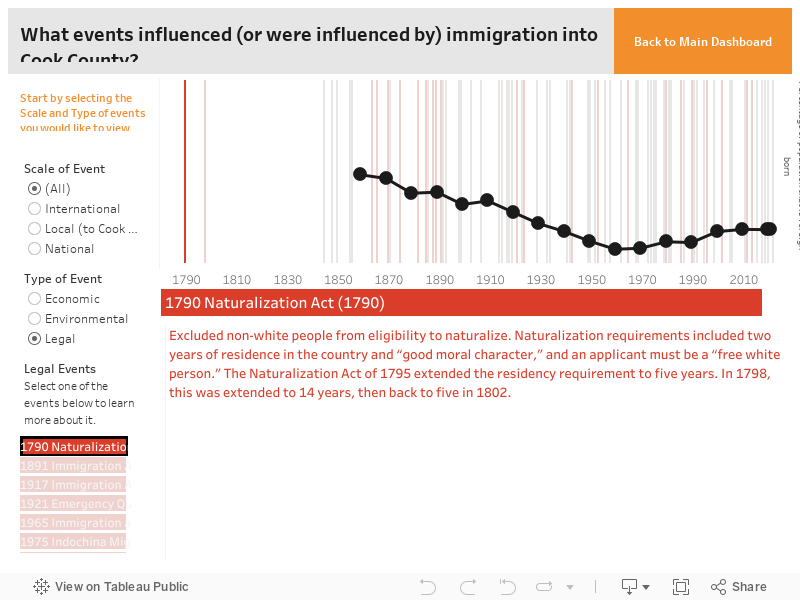
What events influenced (or were influenced by) immigration into Cook County?
Which countries are people migrating from?
Where in Chicago do immigrants settle?
How has the population makeup of Chicago changed over time?
How do foreign born residents differ from native born residents economically?
While there has been a lot of quantitative analysis around immigration in America, we wanted to focus in on Cook County and Chicago. We hope that these explorations can help others better understand the past and present states of immigration into Chicago.
Datasets
We primarily used data from the American census, including the Decennial Census, as well as the yearly American Community Surveys. Both datasets are collected by the Census Bureau, a Part of the US Dept. of Commerce.
Population and Birthplace datasets:
The Population and Birthplace were taken from IPUMS and NHGIS. IPUMS consists of microdata samples from United States census records. The records are converted into a consistent format and made available to researchers through a web-based data dissemination and analysis system.
IPUMS is housed at the Institute for Social Research and Data Innovation (ISRDI), an interdisciplinary research center at the University of Minnesota, under the direction of Professor Steven Ruggles.
The variable used was: Birthplace.
The data was filtered by county, using State ICP / County ICP. NHGIS was used to find the ICP codes for counties as these were different for years before 1950.
These variables were downloaded for 18 cases from 1870 to 2021.
Economic Datasets:
The economic datasets came from the American Community Survey tables:
B06010 Place of Birth by Individual Income in the past 12 months
B06011 Median Income in the Past 12 Months
B06012 Place of Birth by Poverty Status in the Past 12 months
B08511 Means of Transportation to Work by Citizenship Status
B27020 Health Insurance Coverage Status and Type by Citizen
Technical Complexity
All datasets were filtered to Cook County. These were further cleaned and edited as some broke down the data by Citizenship (Naturalized Citizen vs. Not a Citizen), while others broke things down by place of birth. These were combined to compare just “Foreign Born” vs “Native Born” and were checked with the total population to ensure correctness.
In some cases, only data for Chicago was available, and some years did not include breakdowns by place of birth for Cook County. These had to be filtered out accordingly. R was used to decode the data.
The final visualization takes the form of 5 different exploratory dashboards, each focused on one topic or question to be answered. Each dashboard includes a range of interactivity, including parameters and filters to sort and explore different variables, and additional information/ charts in tooltips. To accomplish this, we used LOD, context filters.